Heatmap of S&P Case-Schiller U.S. National Home Price Index, Year-over-Year Price Appreciation
Every month we’ll update the heatmap below to show the year-over-year price appreciation for homes in the U.S. Percentages represent year-over-year changes in a given month and are based on the S&P Case-Schiller U.S. National Home Price Index. Color scale reflects changes relative to all other periods shown during the ~25-year-period table. Red represents lowest value, whereas the teal represents highest value relative to appreciation in other periods shown.
Key Takeaways from March 2023 Index (May 30, 2023 Release):
- S&P CoreLogic Case-Shiller data reveals a 0.4% increase in national home prices in March. This marks the second consecutive month of growth.
- Year-on-year prices in March rose by 0.7%, a slower pace compared to February’s 2.1% increase.
- Miami and Tampa, Florida, saw the most significant year-over-year price increases among large metro areas.
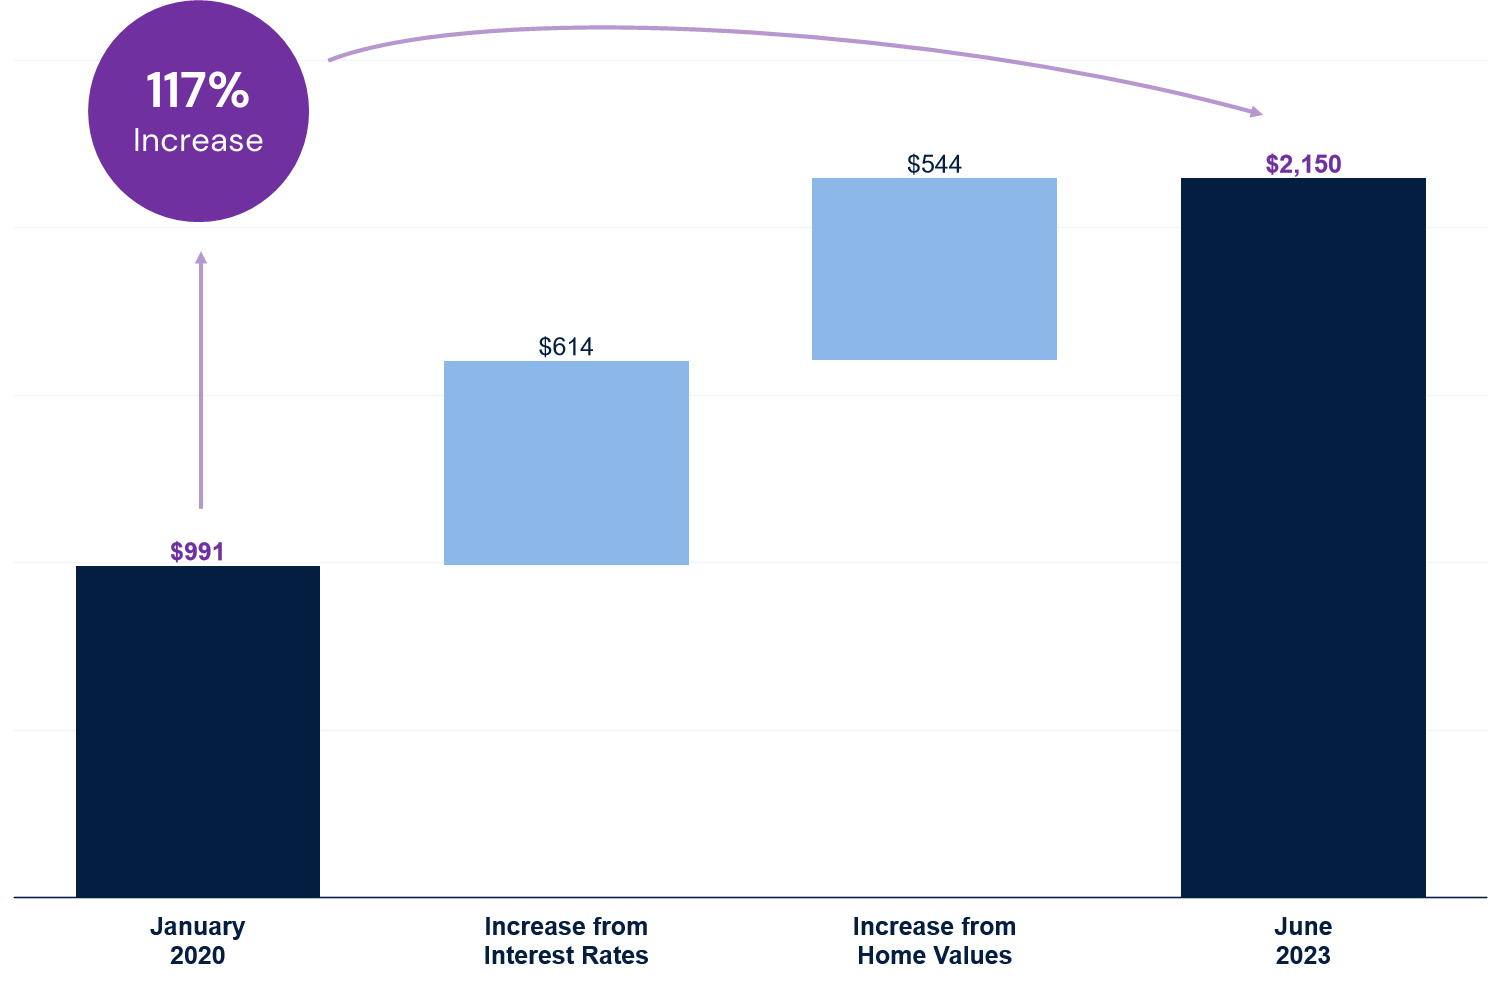
- Current high borrowing costs, with the average 30-year loan rate reaching 6.57%, may continue to drag on housing prices in the coming months.

Key Takeaways from the S&P Case-Shiller Home Price Index (March 2023):
March saw a rise in S&P Cash-Shiller Home Prices for the second month in a row. According to data from S&P CoreLogic Case-Shiller, there was a 0.4% increase in prices nationwide compared to the previous month. This increase could be attributed to demand picking up in certain areas of the U.S. as homebuyers become accustomed to higher borrowing costs that spiked last year.
However, despite the increase, home sales have been slow as homeowners hesitate to sell their properties and give up lower rates, leading to limited inventory for previously owned homes. Despite the consecutive months of increase, it’s too soon to call this a definitive recovery, with future price trends still uncertain due to high borrowing costs and potential economic instability.
Yearly price growth was slower in March, with a rise of 0.7% compared to February’s 2.1%. Among the largest metro areas, Miami and Tampa in Florida recorded the highest year-over-year increases. Borrowing costs remain a significant challenge for buyers as mortgage rates have surged recently due to discussions about the U.S. debt ceiling. The average rate on a 30-year loan rose to 6.57% last week, a substantial increase from 3.22% in early January 2022. This high mortgage rate environment is expected to put pressure on housing prices in the next several months.